
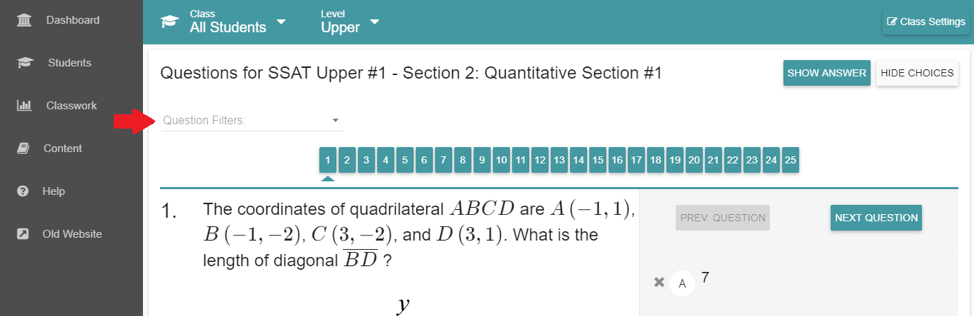
01/29/2020 Update: New filter tool for test sections in Teacher Tools Content tab
Purpose: Let educators filter sections by question difficulty & question type, just as students can do in their completed section view.
01/29/2020 Update: New Delete buttons for Classwork and Custom HW
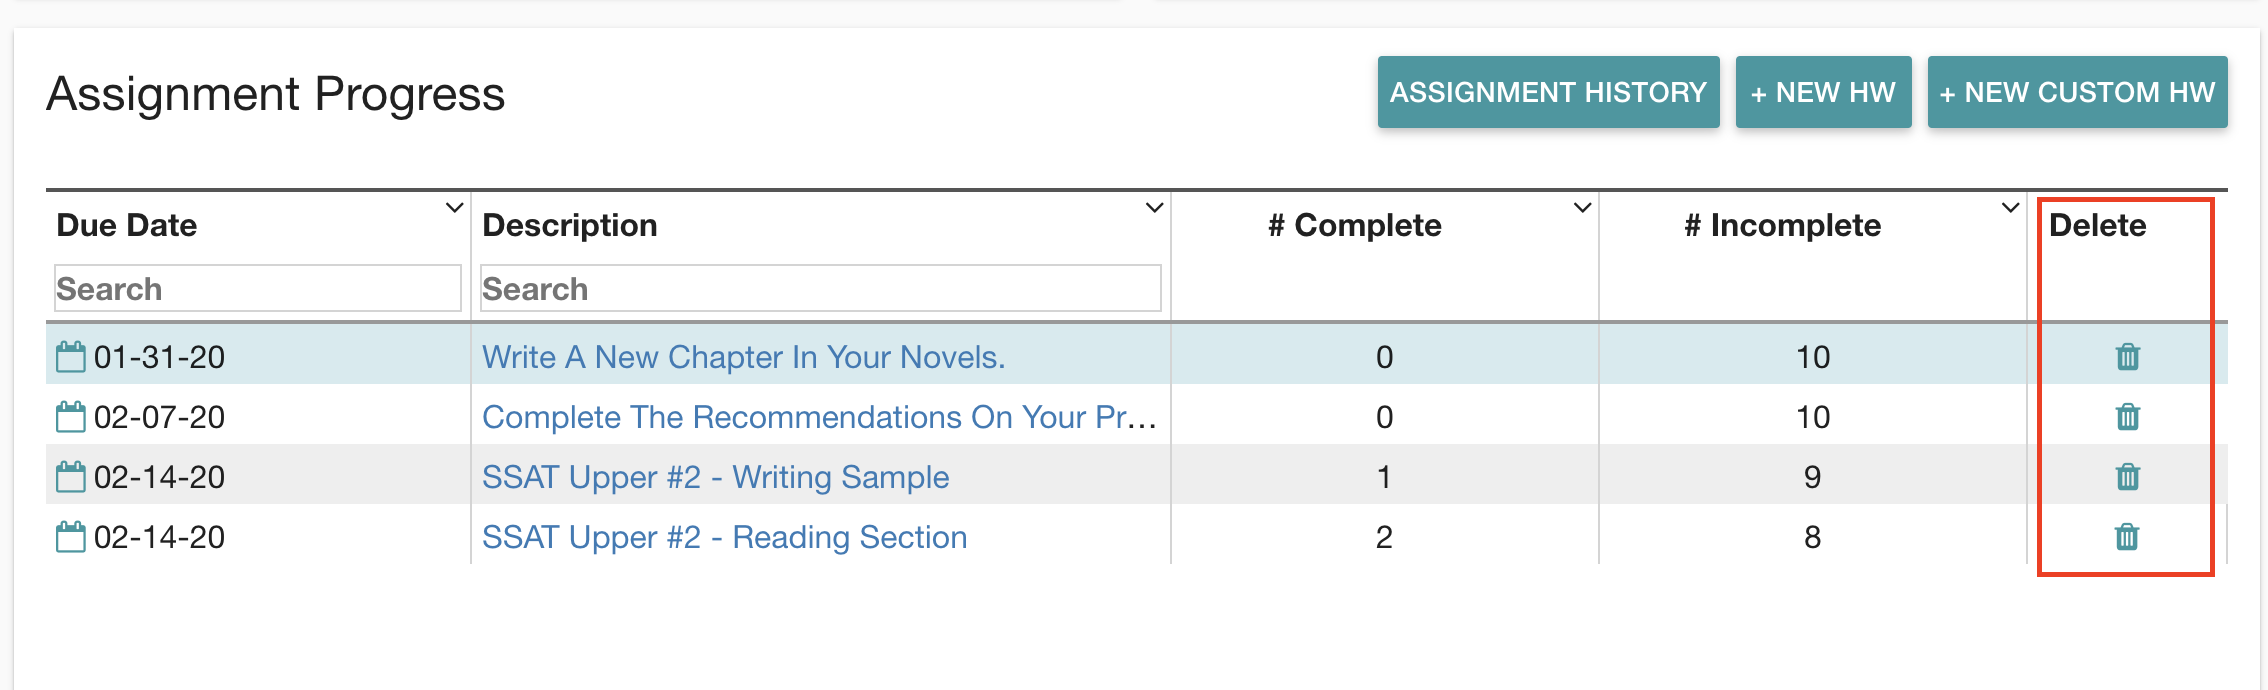
Added a Delete column on the Assignment Progress table in the Classwork tab. Teachers no longer have to click into the assignment. In Edit Prep Plan section of an individual student’s profile, added a delete option (trash can) for custom HW assignments. This was missing before.
01/29/2020 Update: Student view changes
1. Added toggle-able options to Hide Answer and Answer Choices in completed section view
Purpose: Students benefit greatly from reviewing questions they missed. Add toggles to let them hide answers and answer choices for sections they’ve completed.
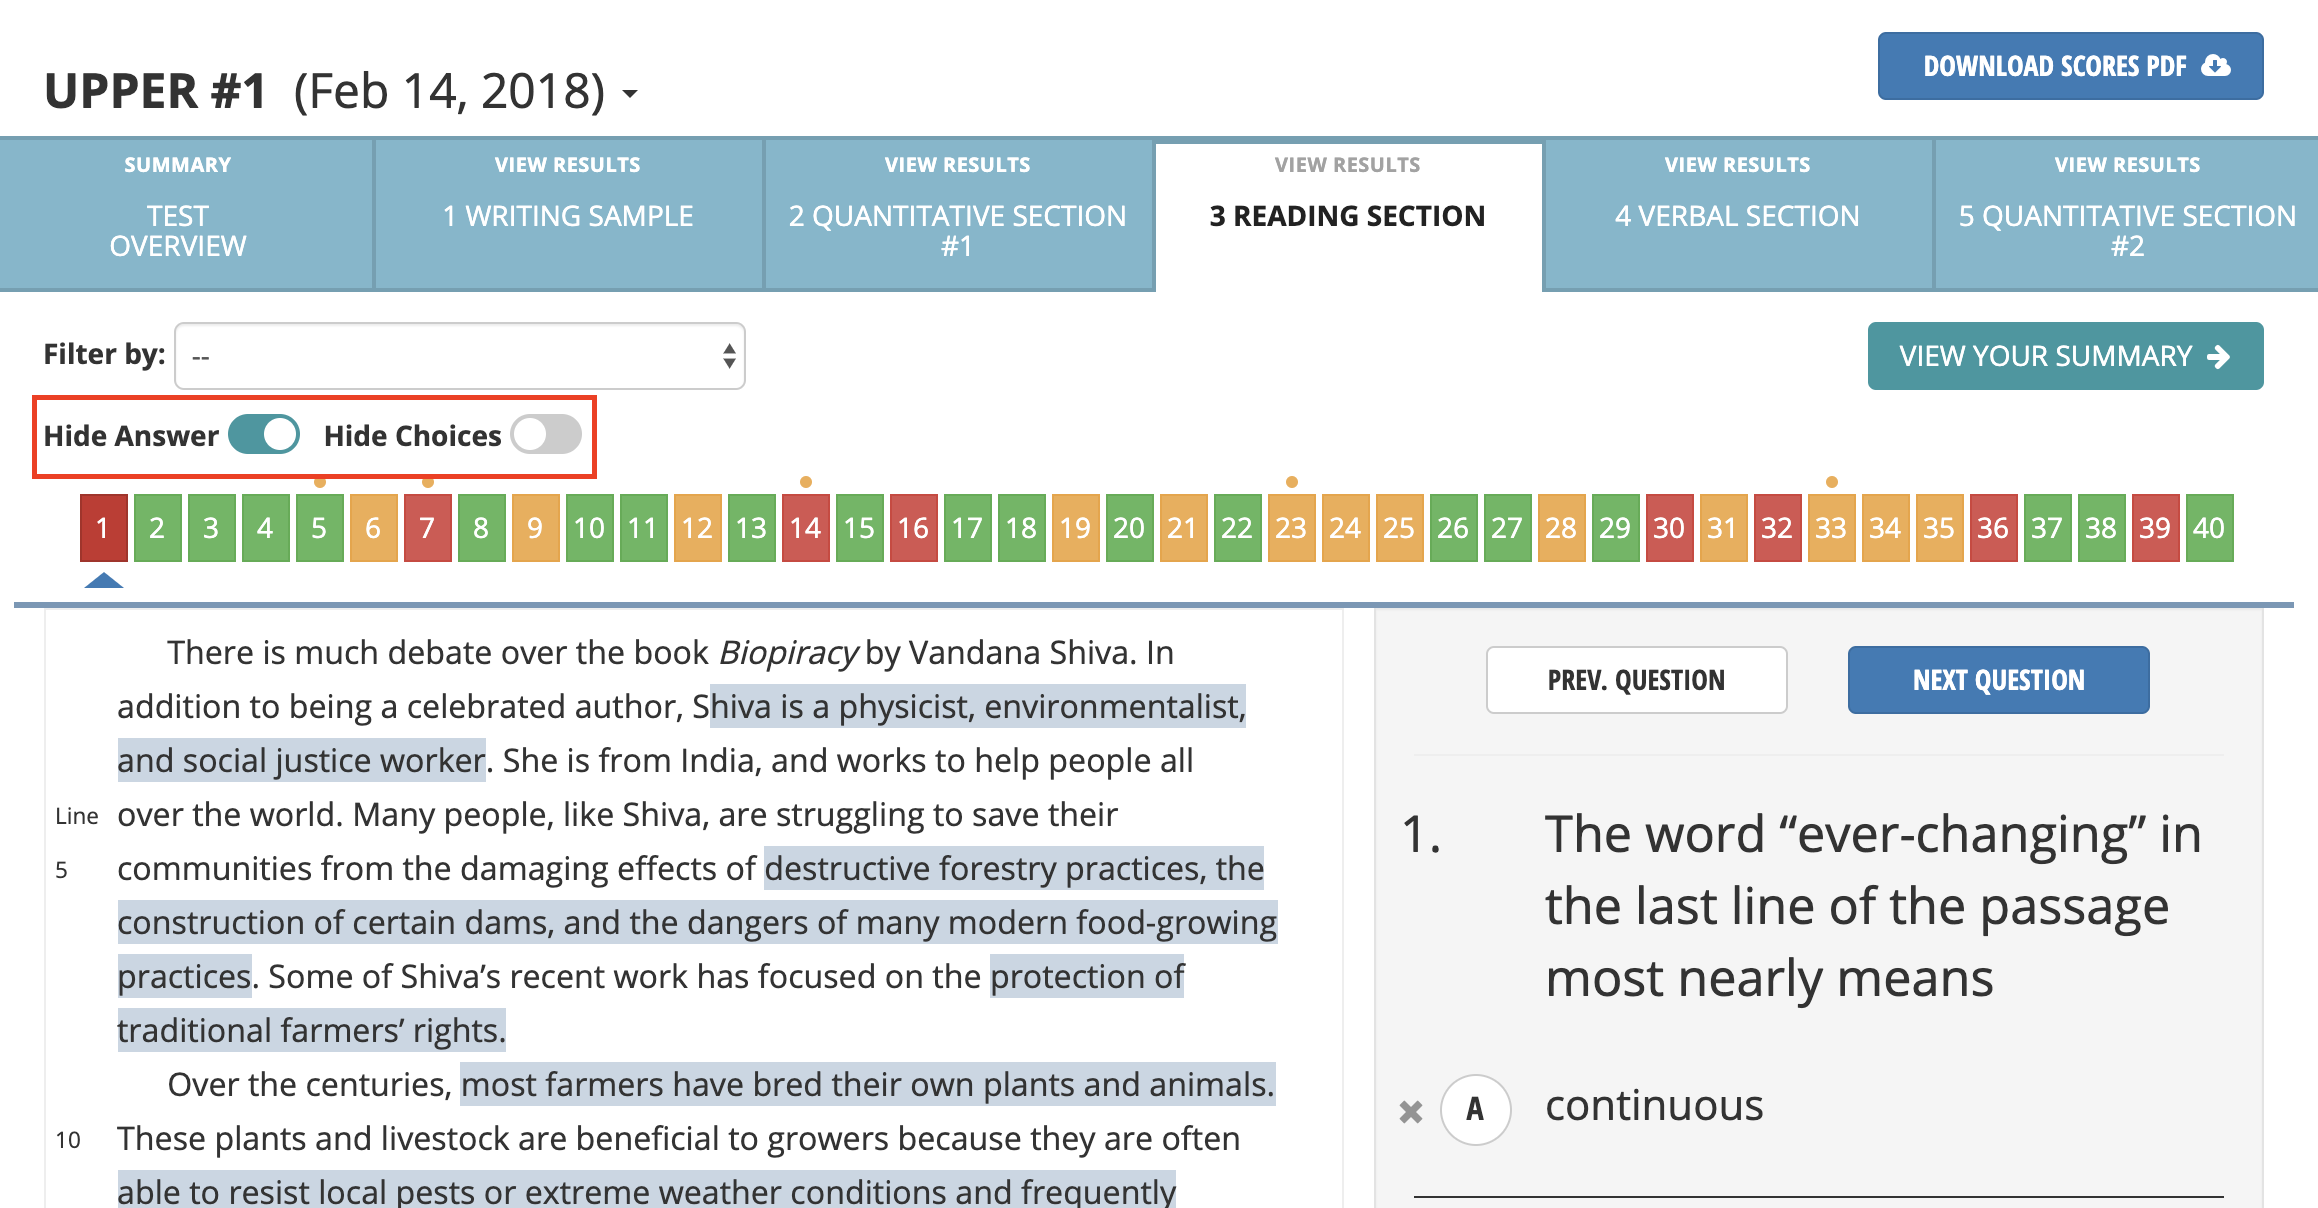
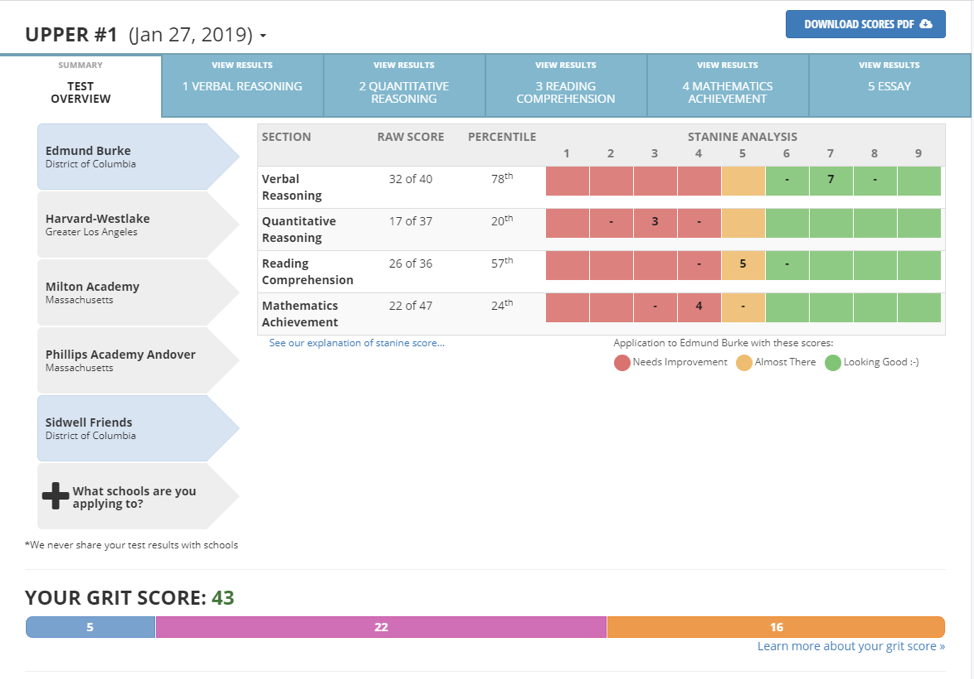
Use the Hide Answer toggle to hide the correct answer, the answer that you selected, and the answer explanation. Use the Hide Choices toggle to hide the answer choices as well.
2. Moved Download Scores PDF button to the upper right-hand corner of analysis tab
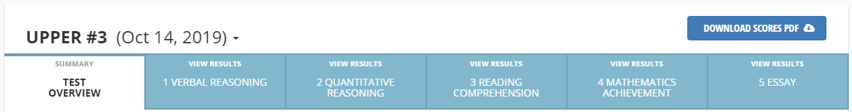
3. Moved Grit Score onto Analysis tab
----------
01/14/2020 Update: Educator admins can set test-locking defaults for new students
Purpose: Give educators the power to decide which tests new students have access to. This benefits educators who add accounts gradually but want all students to start by taking (e.g.) Test #1. It also helps educators who have late additions to classes that should be working at a set pace.
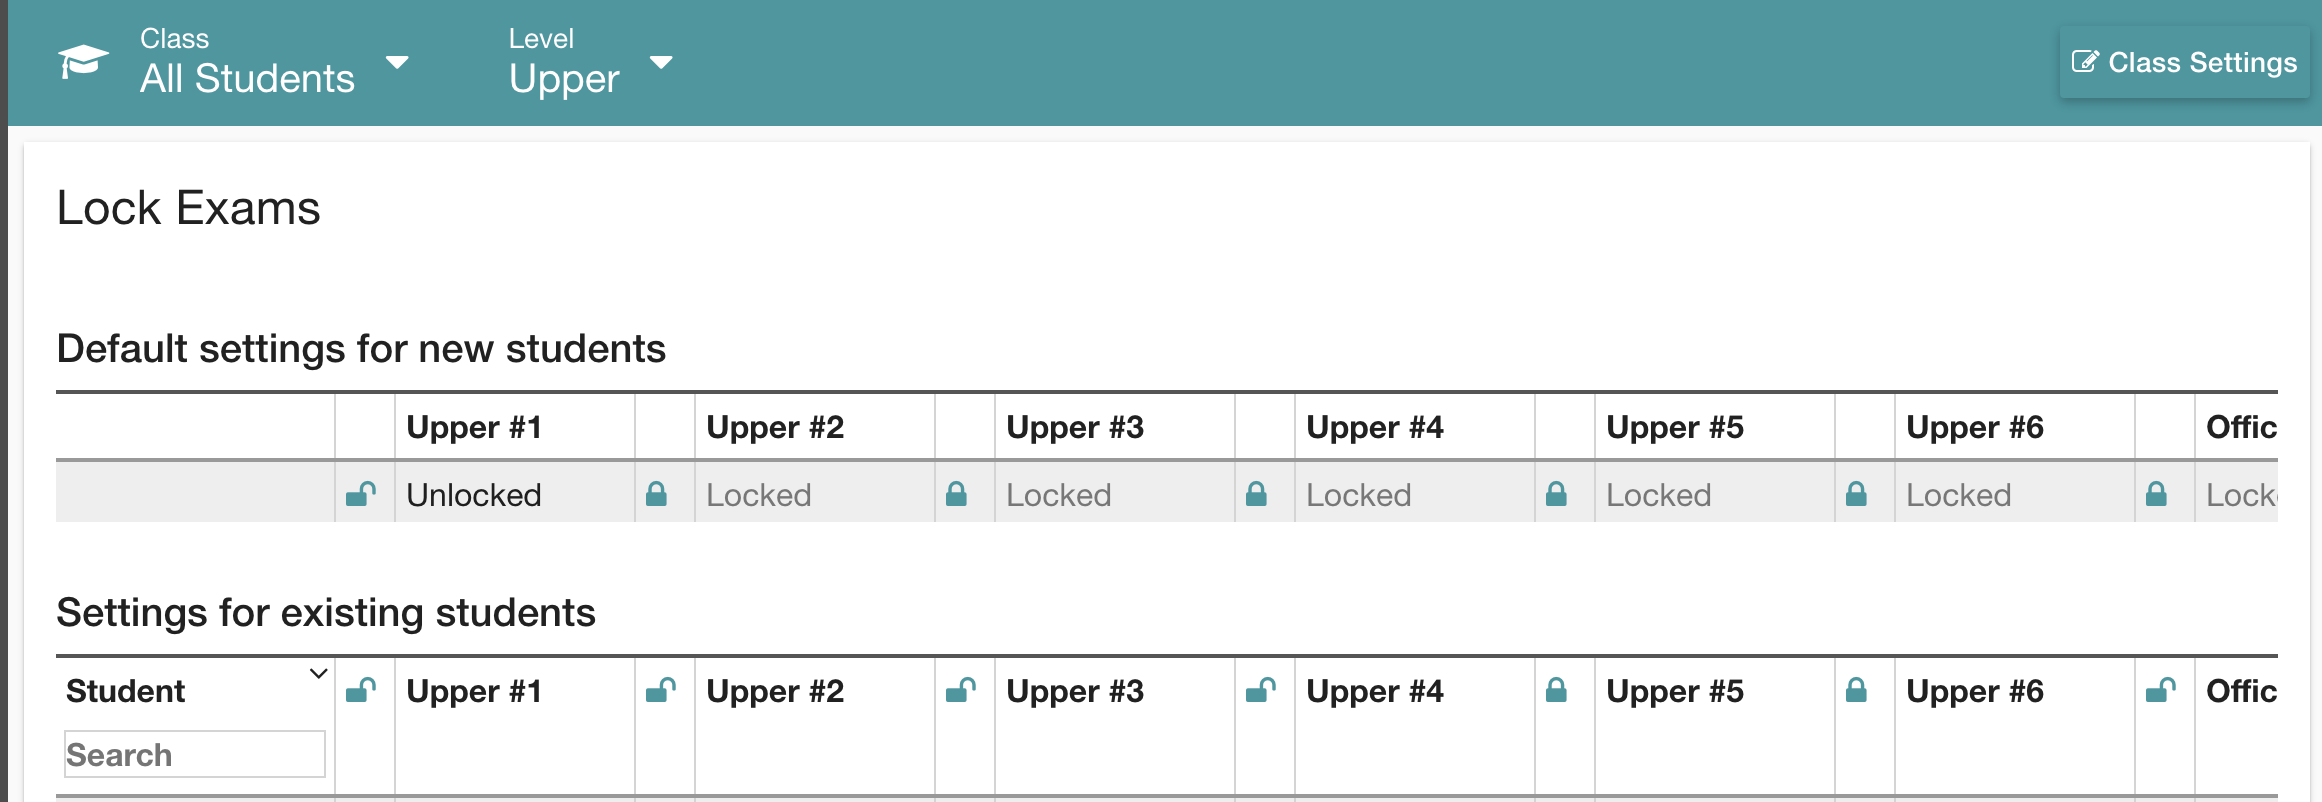
This new setting is located in Class Settings under Lock Exams. The old functionality for locking tests individually will still be under this new Default Setting. This is designed especially for schools & tutoring organizations who want all of their students to be working at the same pace.
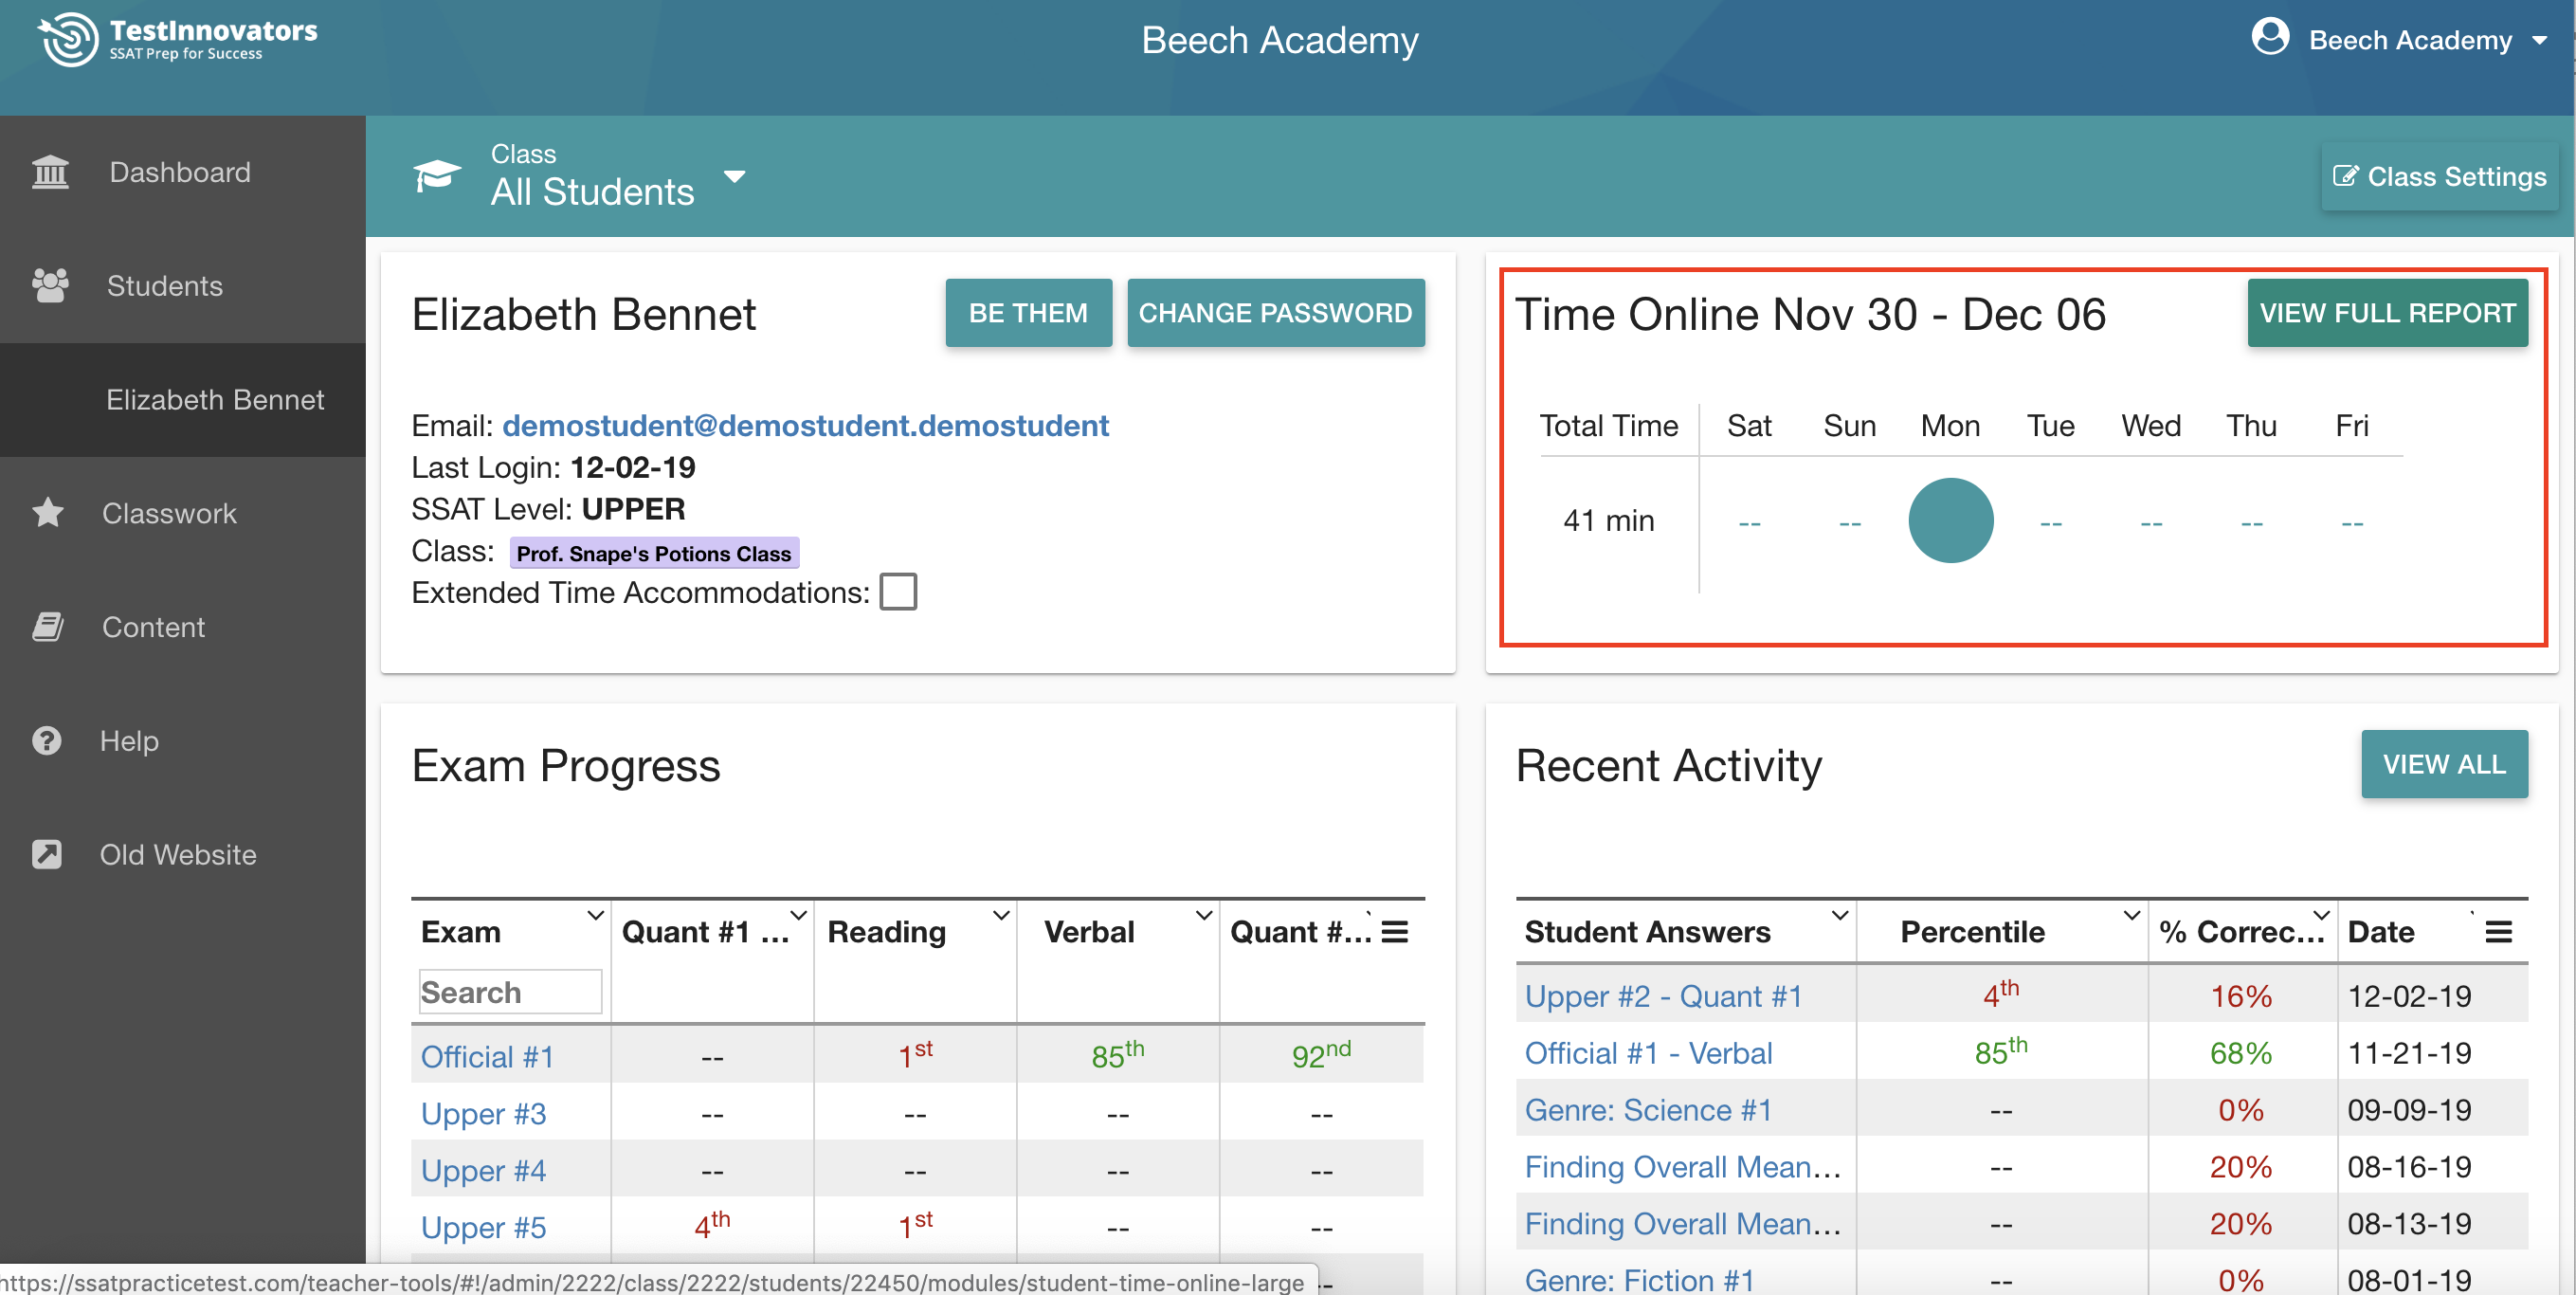
01/14/2020 Update: Date range added to Time Online graphs in Class Snapshot
Purpose: Let educators interact with historical time-online data for their students.
Previously, the Class Snapshot chart (on educators’ Dashboard tab) displayed only the past 7 days of data. Now, educators can use the date-picker tool to select the range they would like to view.
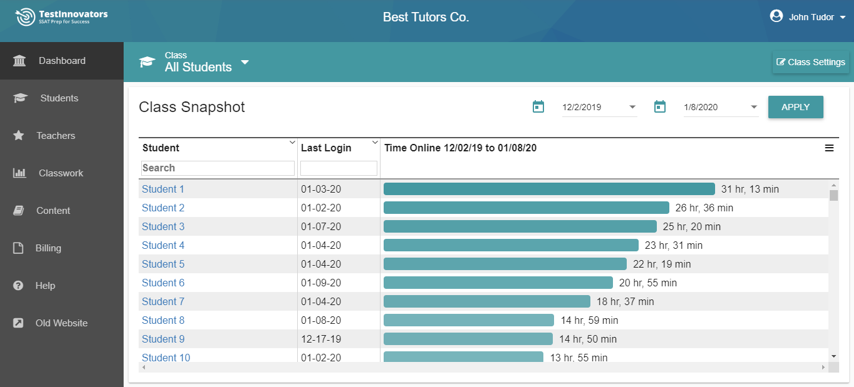
Note: Data goes back to 9/19/19 when time-online tracking was implemented
01/14/2020 Update: New Teacher tab in Educator Tools
Purpose: Make it easier for school admins to find the Teachers tool.
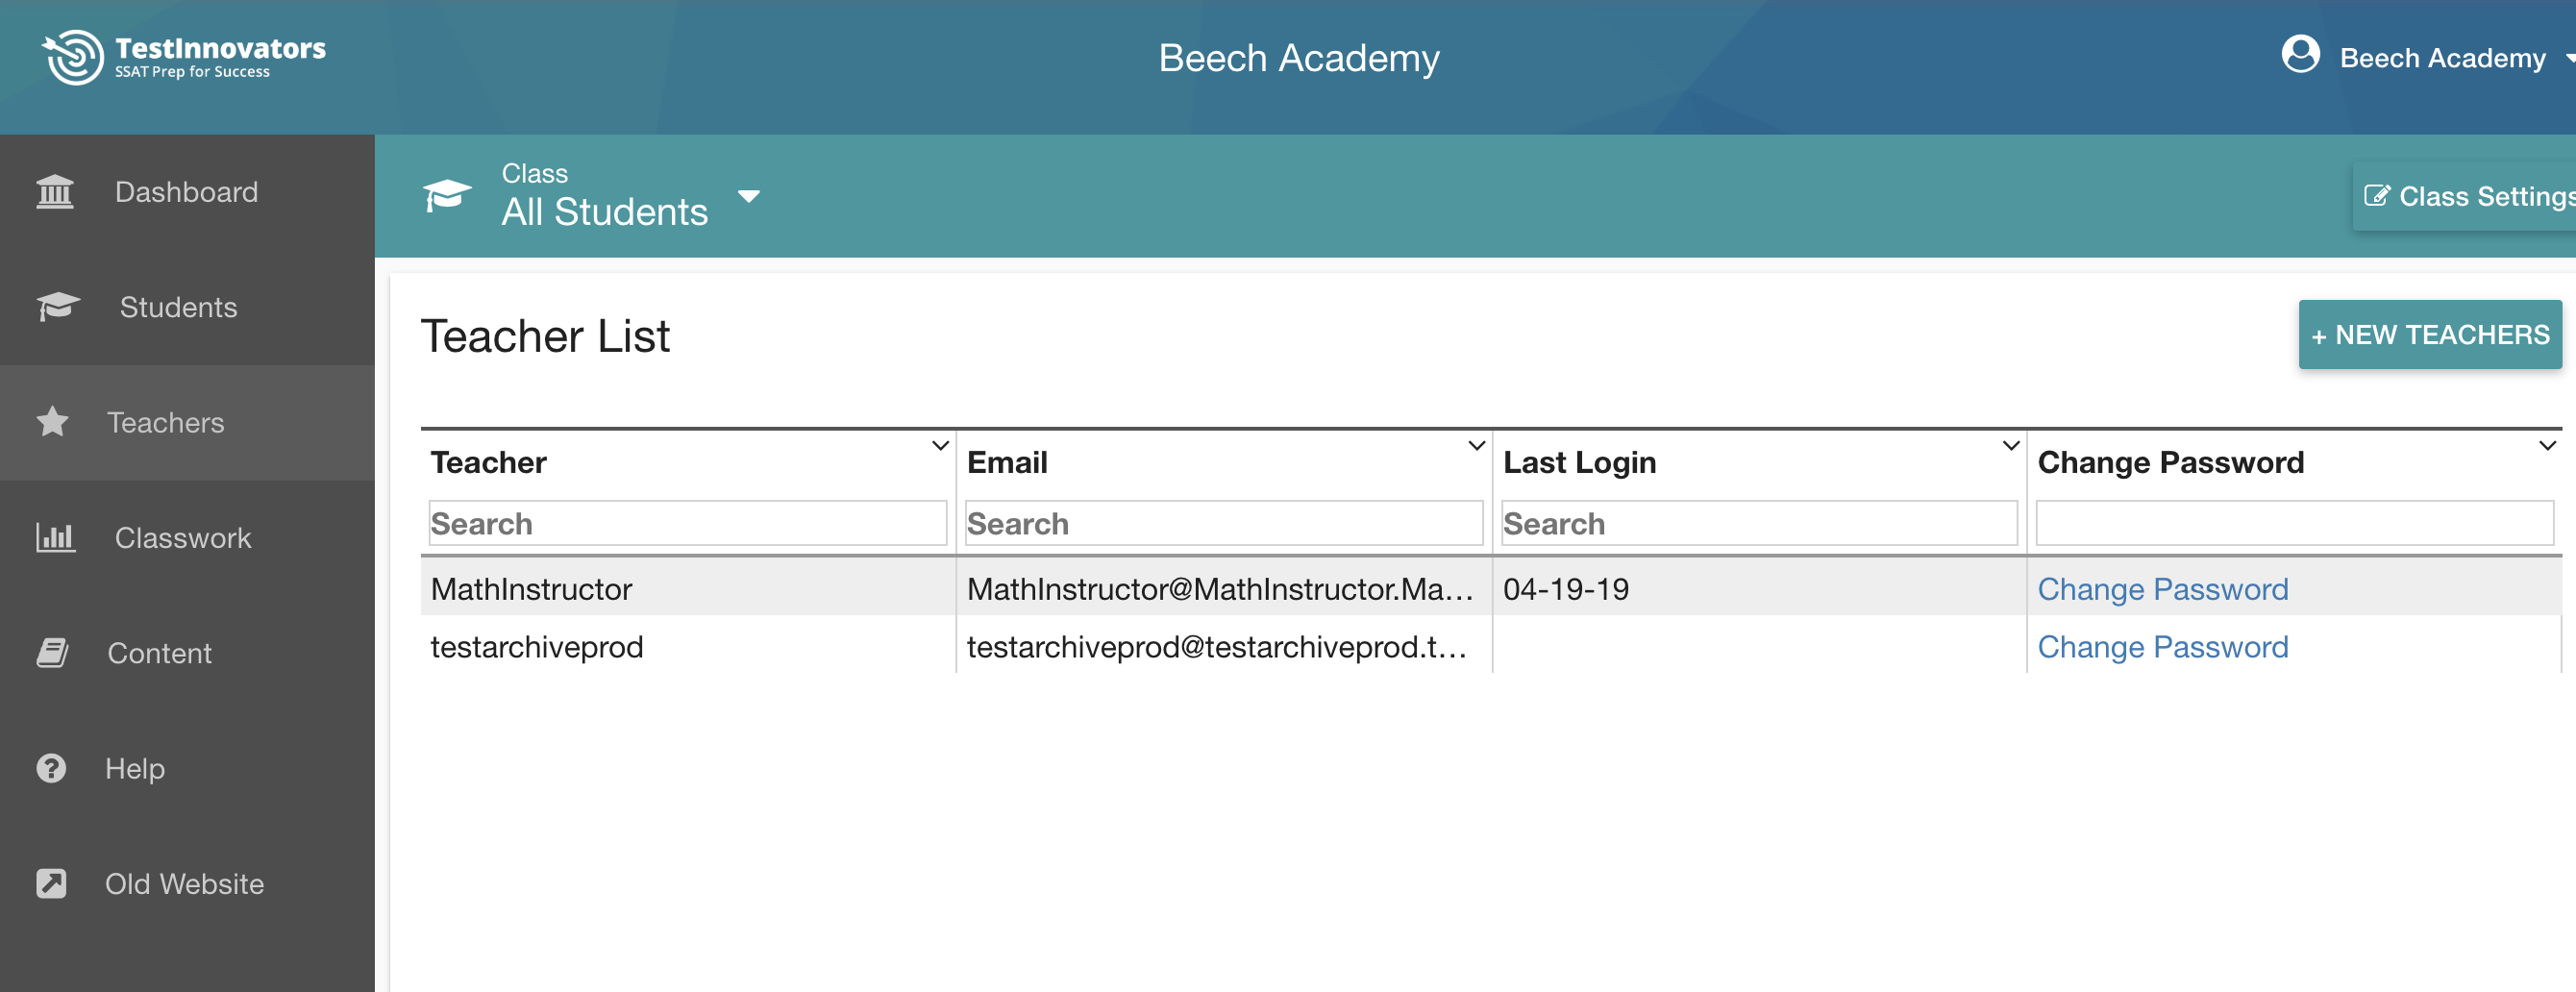
This tab will only be visible for the network admin account, so teachers will not see this tab.
01/14/2020 Update: Added Student Growth Percentile to ISEE & SSAT growth chart area
Purpose: show how students improve from test to test, compared to their peers with comparable initial test scores.
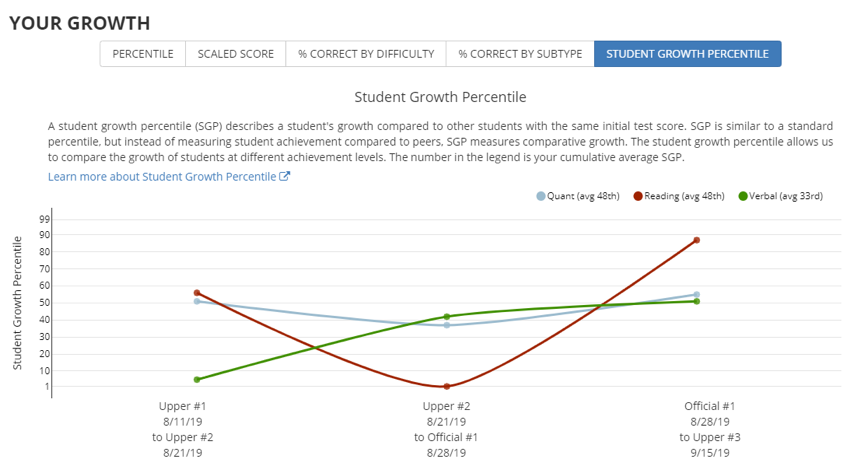
This will be visible for any ISEE/SSAT student who has completed two or more full-length practice tests. New Student Growth Percentile tab is in the Your Growth section of the Analysis page. For more information about the Student Growth Percentile, see our FAQ here.
----------
12/09/2019 Update: New student-growth graphs
Purpose: Provide more granular information about student growth on their Analysis page when they have completed 2 or more tests.
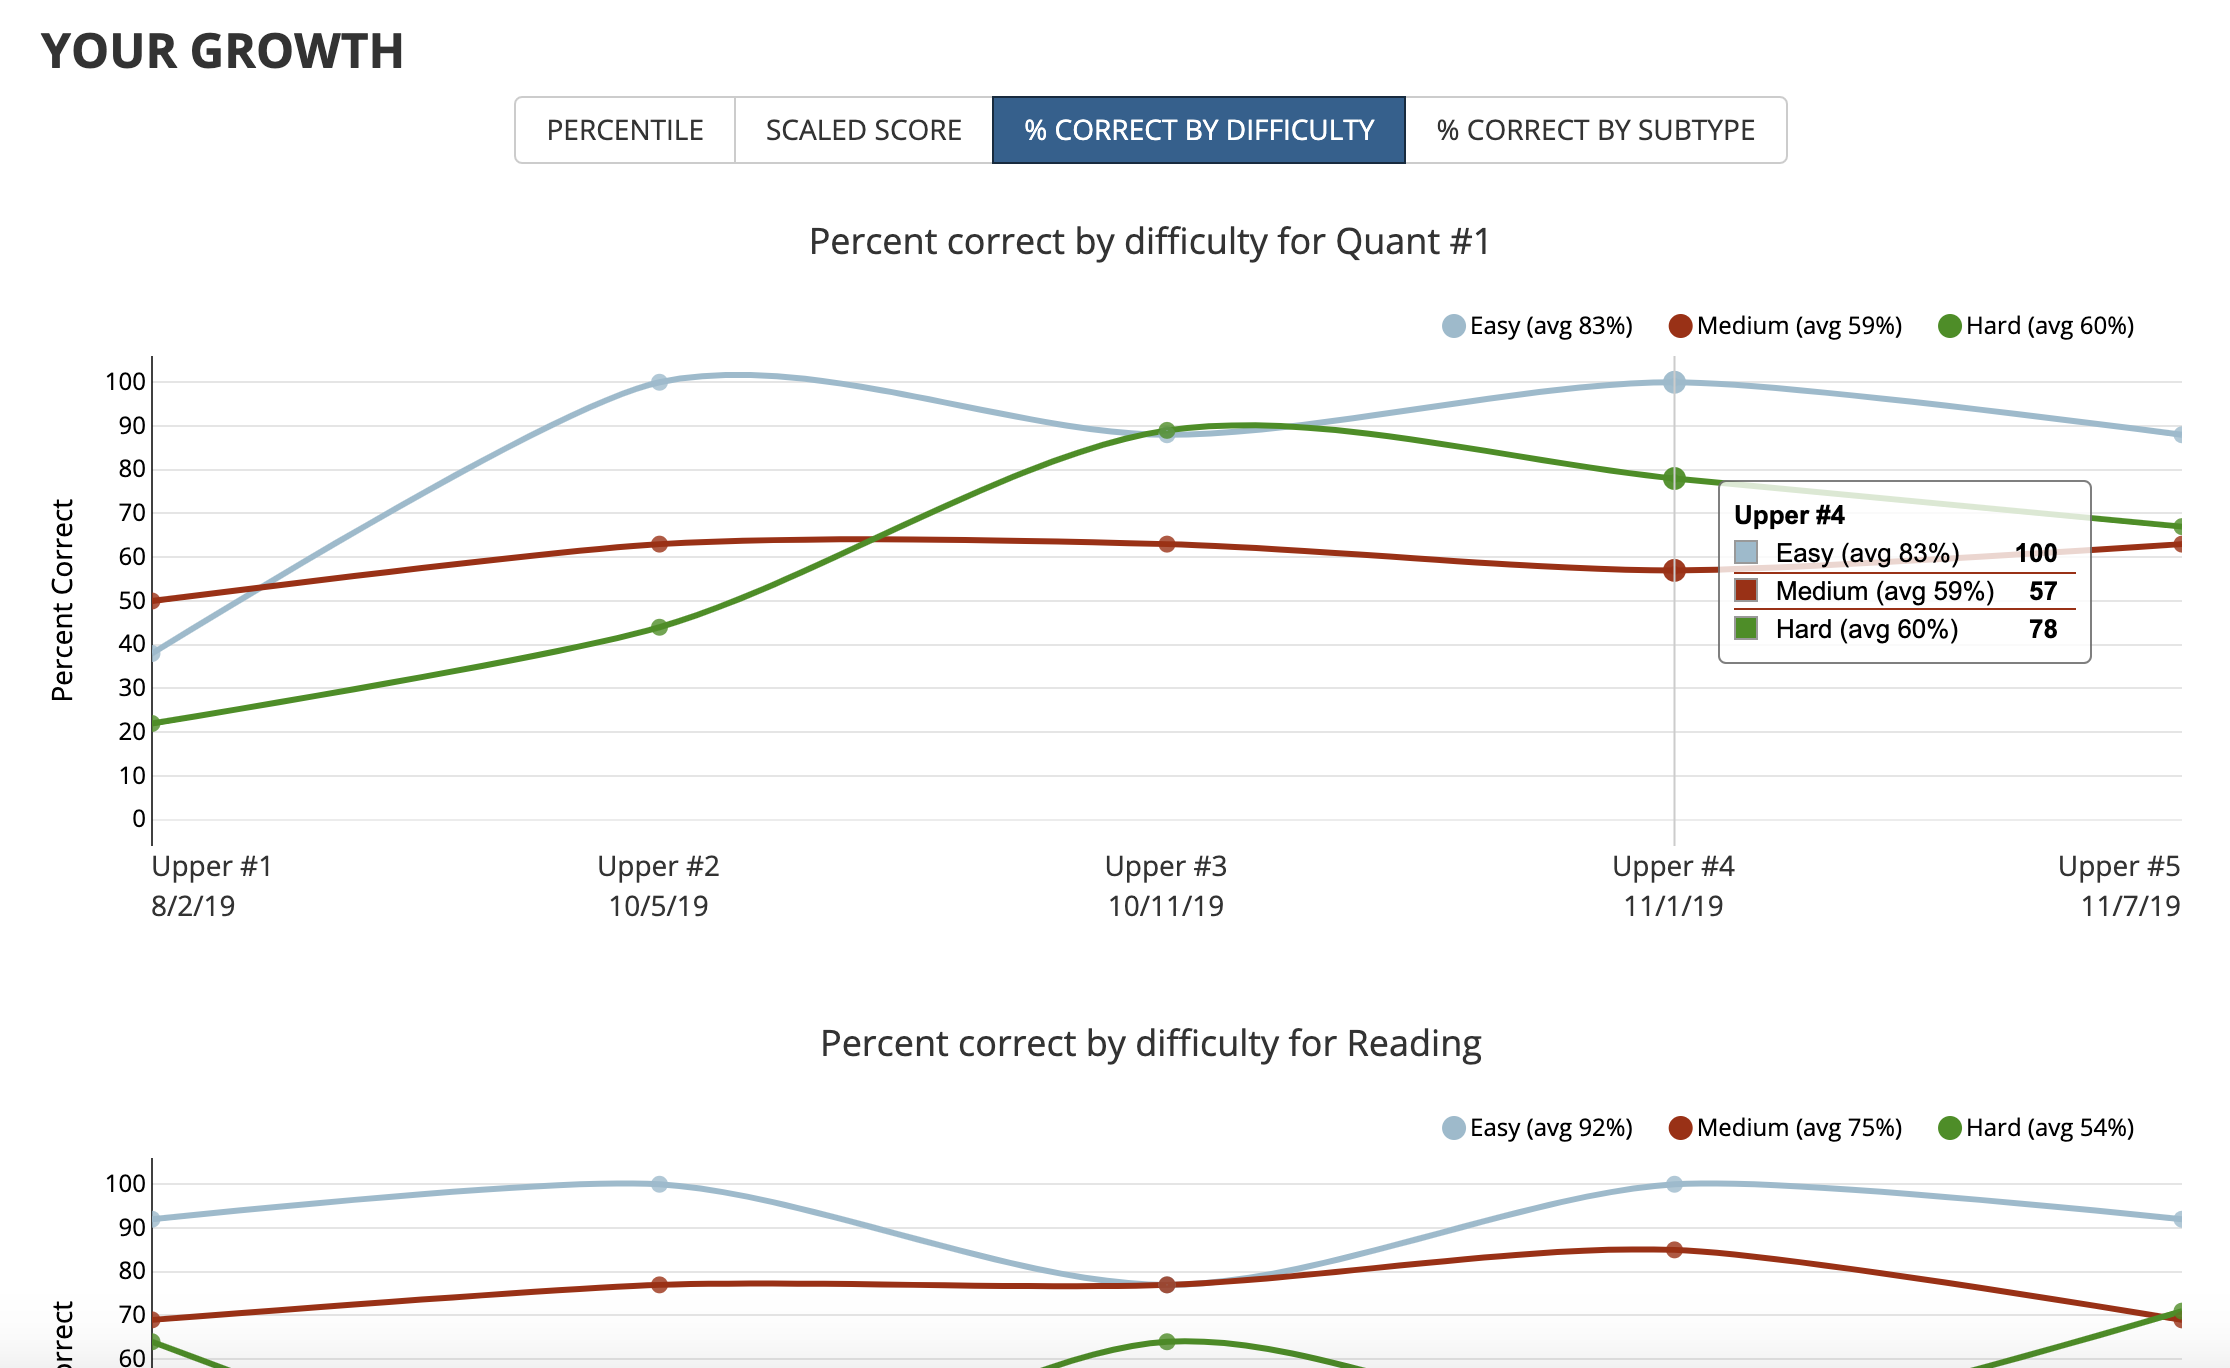
Previously, growth graphs provided only a raw % correct for each section and percentiles. Charts have been added for:
-Percent correct by subtype (e.g. synonym questions)
-Percent correct by question difficulty (easy/medium/hard)
-Scaled score for the SSAT site
Student averages for each metric are visible as you scroll over each test sitting and there is a label for retaken tests.
----------
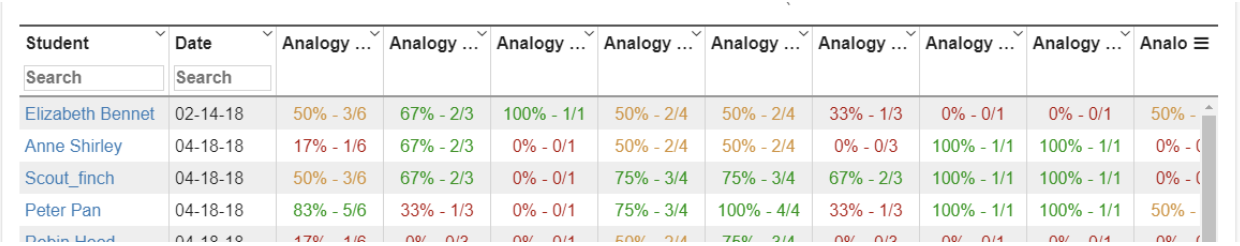
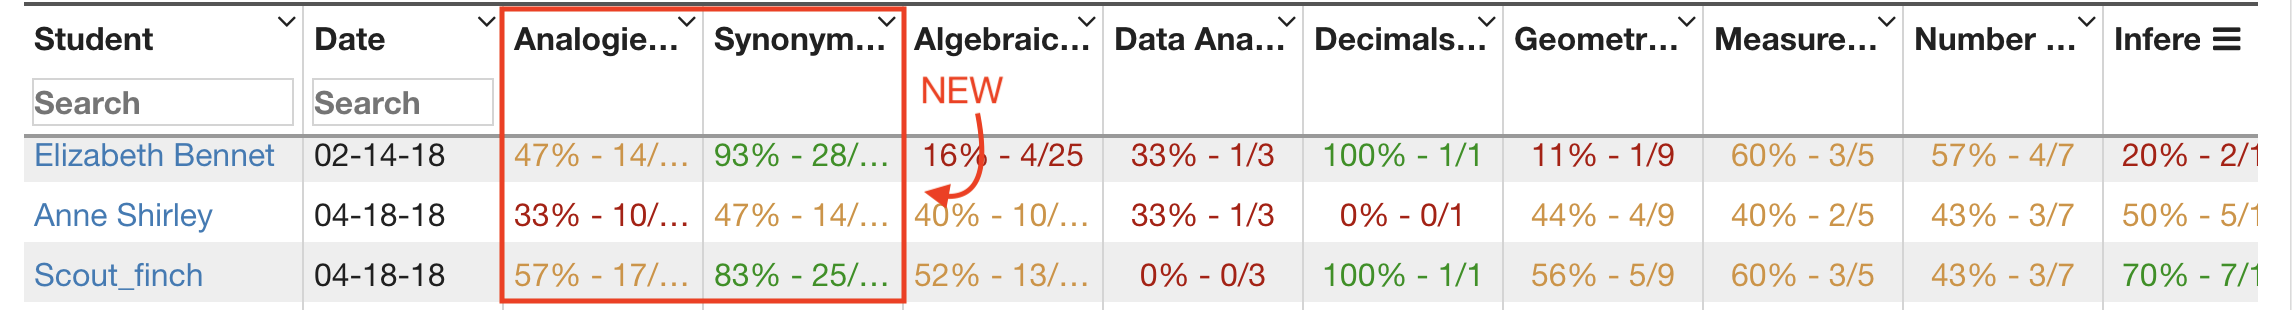
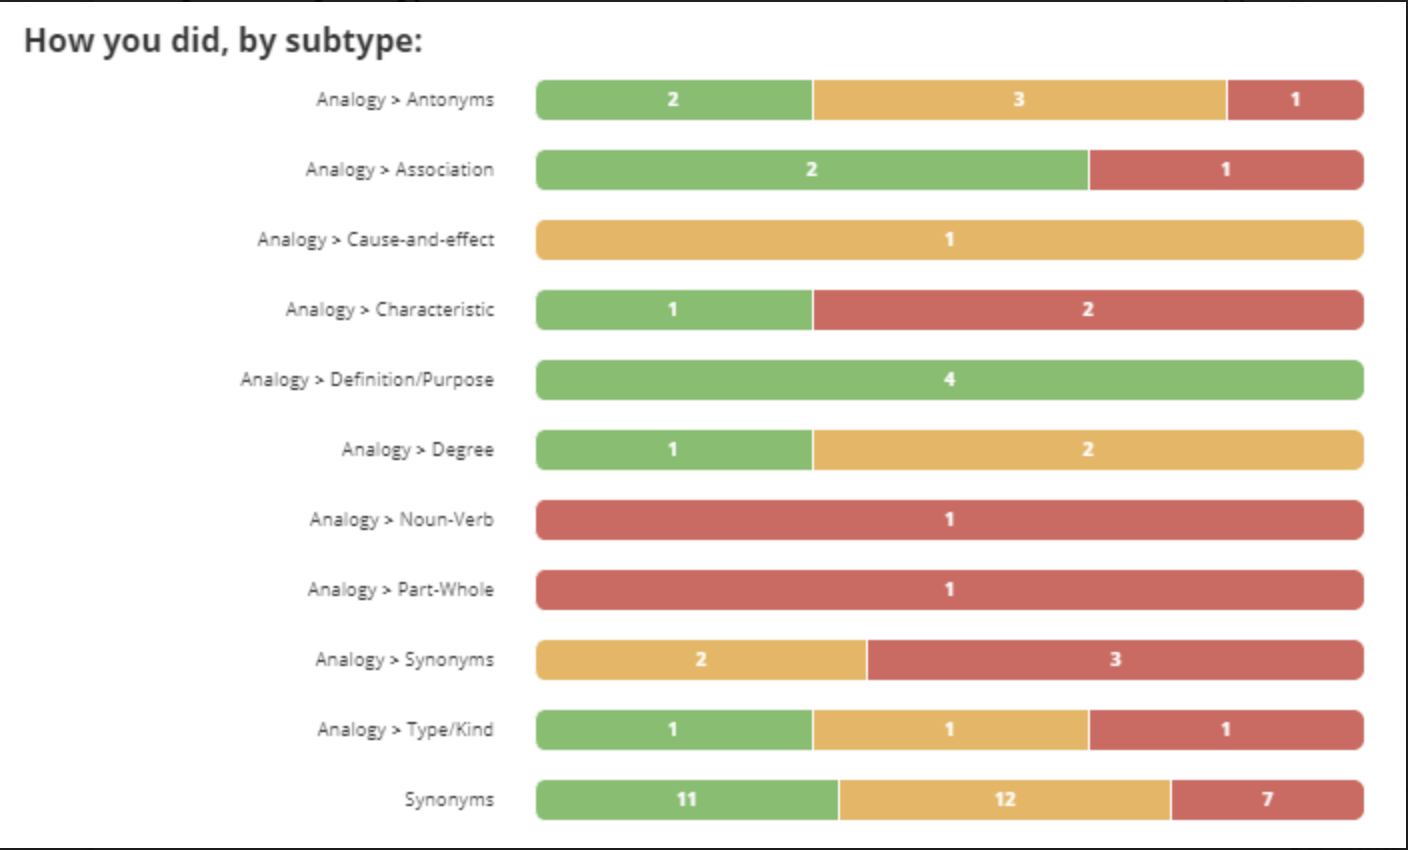
12/04/2019 Update: Distinct SSAT analogy subtypes
Distinct SSAT Analogies subtypes merged into one subtype. This difference will be seen in the student section results, as well as the educator tool class exam results.
Purpose: Make it easy for students and educators to understand performance on SSAT analogies as an overall concept. Previously, analogies were broken out by specific question type (e.g. Cause-and-effect relationships) and many subtypes only had one question each.
Before and after in the Teacher Tools:
To get here, click Classwork tab, then select an Exam title (e.g. Upper #1) from Class Exam and Section Results. Then, click the Subtypes toggle at the top of the card.
Before and after in the student view:

----------
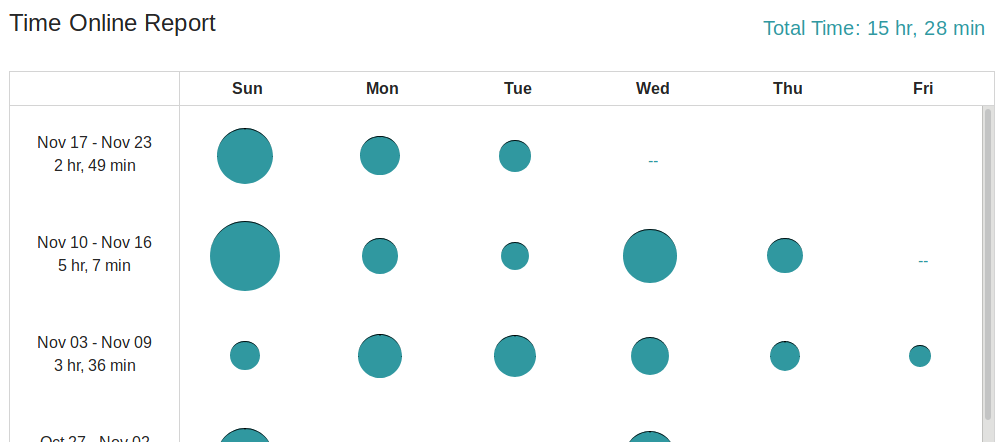
11/20/2019 Update: Time-online reports
For a more in-depth look, see our Time Online Reports article.
New bubble chart that shows a students total time online, by day, since Sep 19th. This report can be found when looking at an individual student, under their weekly time online summary, and clicking View Full Report.
Full Report View:
----------
11/07/2019 Update:
New Time Online Report for the Classroom and New Individual Student Time Online Report.
For a more in-depth look, see our Time Online Reports article.